Z-Score Confidence Interval: In-depth Guide with Step-by-Step Example
Understanding the concept of a confidence interval is crucial in inferential statistics, which aims to make predictions about a population based on a sample. One of the most common techniques involves the use of the Z-distribution. In this article, we'll dive into the formula for a confidence interval and walk through a detailed example.
The Basics of Confidence Intervals
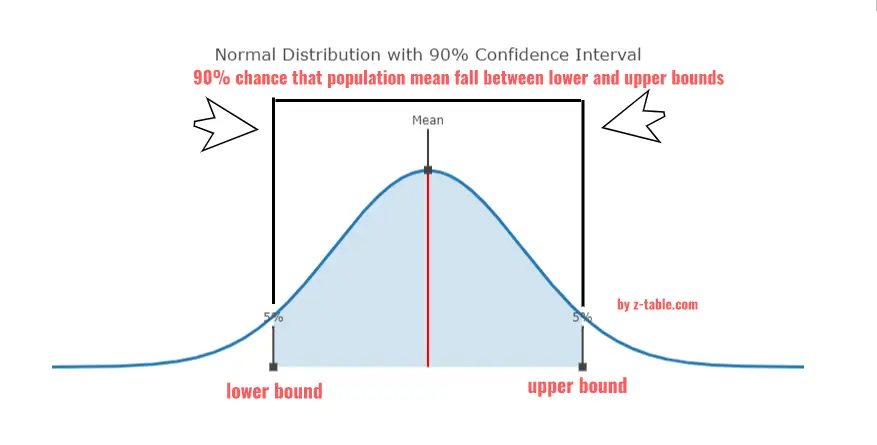
A confidence interval is a range of values, derived from a data sample, which is likely to contain the value of an unknown population parameter. The confidence interval is usually specified by an associated confidence level that quantifies the level of confidence that the parameter lies within the interval. The confidence level represents the frequency (i.e., the proportion) of possible confidence intervals that contain the true value of the unknown population parameter.
The Z-Distribution
The Z-distribution, also known as the standard normal distribution, is a special case of the normal distribution. It is a continuous, symmetric distribution, centred at zero, and its standard deviation is one. It's used when the population mean and population standard deviation are known.
The Confidence Interval Formula
In the context of the Z-distribution, the confidence interval (CI) for a population mean (μ) can be calculated from the sample mean (x̄), sample size (n), population standard deviation (σ), and a standard score known as the Z-score. The formula is:
CI = x̄ ± Z * (σ/√n)
Here:
The term 'Z * (σ/√n)' is called the margin of error.
The Z-score is the number of standard deviations a given proportion falls away from the mean in a normal distribution. The selection of Z is determined by the desired level of confidence. For instance, a 95% confidence interval corresponds to a Z-score of approximately 1.96.
- x̄ is the sample mean
- Z is the Z-score
- σ is the population standard deviation
- n is the sample size
The term 'Z * (σ/√n)' is called the margin of error.
The Z-score is the number of standard deviations a given proportion falls away from the mean in a normal distribution. The selection of Z is determined by the desired level of confidence. For instance, a 95% confidence interval corresponds to a Z-score of approximately 1.96.
Z-Score Confidence Interval Step-by-Step Example
Let's walk through an example. Suppose we have a population of students, and we want to estimate the average height. We know from historical data that the population standard deviation σ is 2.5 inches. We select a sample of 100 students (n = 100) and find the average height to be 67 inches (x̄ = 67). We want to find the 95% confidence interval for the population mean height.
In conclusion, confidence intervals are a fundamental part of inferential statistics and the scientific understanding of data. By utilizing the Z-distribution and understanding the components of the confidence interval formula, we can make statistically significant estimates about our population parameters, paving the way for informed decisions and insightful data interpretations.
Finally don't forget to check out our confidence interval calculator.
- Identify the sample mean, population standard deviation, sample size, and Z-score: From the problem, we know x̄ = 67 inches, σ = 2.5 inches, n = 100. As we're seeking a 95% confidence interval, we use a Z-score of 1.96.
- Apply the Confidence Interval formula: CI = x̄ ± Z * (σ/√n). Substituting the values in, we get CI = 67 ± 1.96 * (2.5/√100).
- Calculate the margin of error: The margin of error is Z * (σ/√n) = 1.96 * (2.5/√100) = 1.96 * 0.25 = 0.49 inches.
- Find the Confidence Interval: Finally, we substitute the margin of error back into our confidence interval formula. Thus, our 95% confidence interval for the population mean height is 67 ± 0.49, which equates to a range between 66.51 inches and 67.49 inches.
In conclusion, confidence intervals are a fundamental part of inferential statistics and the scientific understanding of data. By utilizing the Z-distribution and understanding the components of the confidence interval formula, we can make statistically significant estimates about our population parameters, paving the way for informed decisions and insightful data interpretations.
Finally don't forget to check out our confidence interval calculator.
