What is a Residual?
More formally in statistics, a residual is the difference between the actual observed value (what really happened) and the predicted value (what your model said would happen). When we use data to make predictions, there's often a gap between our prediction and the actual outcome. This 'gap' is what we call the residual.
To put it into a formula:
Residual = Observed value – Predicted value
Why are Residuals Important?
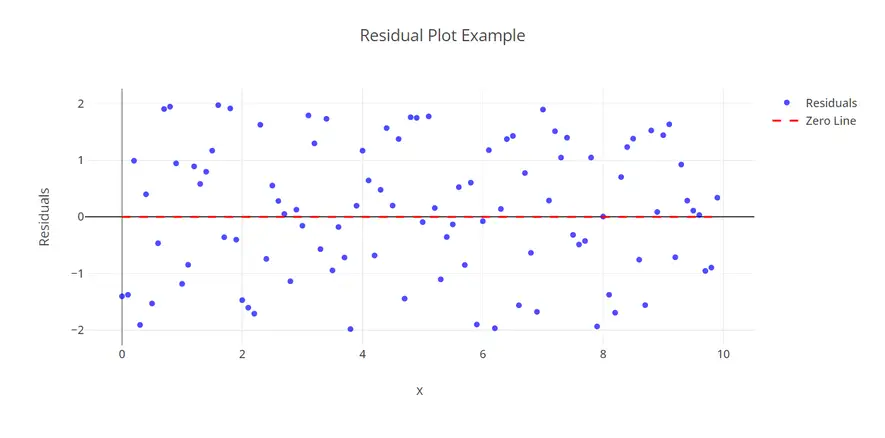
1. Evaluating Model Accuracy: If your model is accurate, your residuals will be scattered randomly and close to zero, with no discernable pattern. If a pattern emerges in your residuals, it's a red flag that your model may not be the best fit for your data.
2. Spotting Outliers: Occasionally, a residual might be significantly larger or smaller than the rest. This can indicate that the corresponding data point is an 'outlier' or an atypical observation, warranting further investigation.
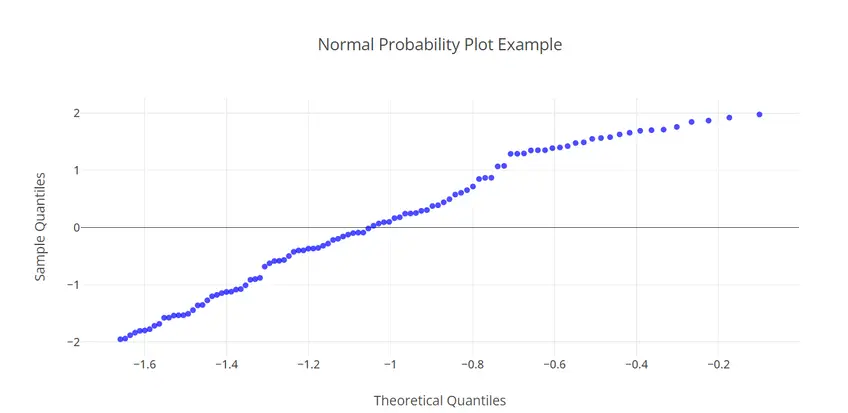
3. Checking Model Assumptions: Many predictive models assume that residuals are normally distributed and exhibit constant variability. By examining the residuals, we can verify whether our data fulfills these assumptions.
Residuals in Linear Regression
e = Y - (a + bX)
Here, Y represents the actual observed value, X is the input variable, a and b are coefficients that the model calculates, and (a + bX) is the predicted value.
Residuals in linear regression inform us about the distance of data points from the regression line (the best fit line through the data). A positive residual means the actual value was higher than the predicted (the model underestimated), and a negative residual means the actual value was lower (the model overestimated).
How to Analyze Residuals?
1. Residual Plots: In a residual plot, residuals (on the vertical axis) are plotted against the input variable (on the horizontal axis). If the points are randomly scattered around the horizontal axis, it implies a well-fitted model. Otherwise, a non-linear model might be more suitable.
2. Normal Probability Plots: In these plots, residuals are sorted and plotted against their expected values if they were normally distributed. If the points follow a straight line, it indicates our residuals are normally distributed.
Example of Calculating Residuals to Improve Sales Predictions
Step 1: The Business Problem
Suppose we're running a retail store and we're interested in predicting sales based on the number of hours we're open each day. We've collected some data over the past 12 days:
| Hours Open (X) | Sales (Observed Y) |
|---|---|
| 8 | 41 |
| 8 | 32 |
| 10 | 35 |
| 6 | 30 |
| 10 | 36 |
| 12 | 37 |
| 6 | 36 |
| 8 | 35 |
| 8 | 41 |
| 10 | 30 |
| 10 | 28 |
| 12 | 29 |
Step 2: Predict Sales with a Regression Model
To predict sales, we first need a model. In this case, we are going to use a simple linear regression model. The regression model has the form `y = ax + b` where 'x' is our independent variable, 'a' is the slope, and 'b' is the y-intercept.
By using statistical methods (which can be done with software like Python, R, Excel, etc.), we find that the best fit line through our data is represented by the formula: `Sales = 0.7553*Hours + 29.63`. This means that for each additional hour we're open, we predict an increase of approximately 0.7553 in sales, with a baseline (when Hours = 0) sales of 29.63.
With this model, we can calculate the predicted sales for each day:
| Hours Open (X) | Sales (Observed Y) | Sales (Predicted Y) |
|---|---|---|
| 8 | 41 | 35.67 |
| 8 | 32 | 35.67 |
| 10 | 35 | 37.18 |
| 6 | 30 | 34.16 |
| 10 | 36 | 37.18 |
| 12 | 37 | 38.69 |
| 6 | 36 | 34.16 |
| 8 | 35 | 35.67 |
| 8 | 41 | 35.67 |
| 10 | 30 | 37.18 |
| 10 | 28 | 37.18 |
| 12 | 29 | 38.69 |
Let's visualize our observed and predicted sales with a scatter plot:
Step 3: Calculate Residuals
Now that we have our predicted sales, we can calculate the residuals.Residuals represent the difference between the observed and predicted sales. They show us how well our model is predicting sales:
| Hours Open (X) | Sales (Observed Y) | Sales (Predicted Y) | Residual |
|---|---|---|---|
| 8 | 41 | 35.67 | 5.33 |
| 8 | 32 | 35.67 | -3.67 |
| 10 | 35 | 37.18 | -2.18 |
| 6 | 30 | 34.16 | -4.16 |
| 10 | 36 | 37.18 | -1.18 |
| 12 | 37 | 38.69 | -1.69 |
| 6 | 36 | 34.16 | 1.84 |
| 8 | 35 | 35.67 | -0.67 |
| 8 | 41 | 35.67 | 5.33 |
| 10 | 30 | 37.18 | -7.18 |
| 10 | 28 | 37.18 | -9.18 |
| 12 | 29 | 38.69 | -9.69 |
Step 4: Visualize and Interpret the Residuals
Visualizing our residuals can provide useful insights. Residuals represent the error between our model's predictions and the actual sales. If our model is good, residuals should be randomly scattered around zero:
Step 5: Improving Our Predictions
Residuals provide valuable insights for improving our model. By analyzing the distribution and patterns in residuals, we can tweak our model to better fit the data. For example, if residuals show a pattern (such as increasing with X), we may consider a more complex model like polynomial regression.
Looking at our plot, we see that this is the case. The residuals do not show any clear pattern - they're scattered around zero. This suggests that our linear regression model is a good fit for the data. This information is very valuable for our business. It allows us to confidently predict our sales based on how many hours we are open, which in turn enables us to better plan our resources.


