Z SCORE TABLE
  • Z Table
    • Z Scores to Percentiles Chart
    • Z Score Calculator
    • Z Score Probability Calculator
    • Interactive Z Table
    • Z Score Formula
    • How to calculate the z score
    • How To Use Z-Score Table
    • Calculate Z-score
    • Probability in Statistics
    • Parameters in Statistics
    • Percentile Rank
    • Z Score Chart Basics
    • History of Normal Distirbution
    • Statistics Z Score Jokes
    • When to Use Z Test vs T Test
    • Z Score Practice Problems
    • Z Score Problems
    • Normal Distribution Problems
    • Confidence Interval Calculator >
      • Confidence Interval in Excel
      • 90 confidence interval z score
      • 95 Confidence Interval Z Score
      • 99 Confidence Interval Z Score
    • Z Score Confidence Interval
  • Statistics
    • Statistics Symbols
    • Statistics Formulas >
      • Binomial Coefficient
      • Empirical Rule
      • Correlation Coefficient
    • P Value Calculator >
      • P Value Calculator from Z Score
      • P Value Calculator from T Score
      • P Value Calculator from Chi-Square
      • P Value Calculator from F Ratio (ANOVA)
      • P Value Calculator from Pearson R
      • P Value Calculator Tukey's Q Score
    • Cumulative Binomial Probability Calculator
    • Normal CDF Calculator >
      • Normal CDF Formula
      • Non-normal Distribution
      • How to find normal cdf ti 84
      • Examples of Standard Deviation
      • Sample Standard Deviation on Calculator
      • Standard Deviation vs Variance
      • Population vs. Sample
      • Quantitative vs. Qualitative Data
      • Formula of Standard Deviation for Grouped Data
      • Null Hypothesis vs. Alternative Hypothesis
      • Discrete vs. Continuous Data
      • Mean vs. Median vs. Mode
      • Bayesian vs. Frequentist Statistics
      • What is High Standard Deviation
      • What Does a Standard Deviation of 0 Mean
      • Observational Study vs. Experimental Study
      • Parametric vs. Non-parametric tests
      • What is 1 Standard Deviation Above the Mean
      • How to find correlation coefficient on ti 84
      • How to find linear regression on ti-84
      • How to find solving equations on ti-84
      • How to find quadratic regression on ti-84
      • How to find factorial on ti-84
      • How to find integrals on ti-84
      • How to find confidence intervals on ti-84
      • How to find z-score on ti-84
      • How to find derivatives on ti-84
      • How to find summation on ti-84
      • How to find anova on ti-84
      • How to find graphing functions on ti-84
      • How to find factorial on ti-89
      • How to find integrals on ti-89
      • How to find standard deviation on ti-89
      • How to find derivatives on ti-89
      • How to find linear regression on ti-89
      • How to find matrix operations on ti-89
      • How to find summation on ti-89
      • How to find variance on ti-89
      • How to find Correlation on TI-Nspire
      • How to find Variance on TI-Nspire
      • How to find Standard Deviation on TI-Nspire
      • What Does a Standard Deviation of 2 Mean
      • How to find Linear Regression on TI-Nspire
      • How to find Quadratic Regression on TI-Nspire
      • How to find Matrix Operations on TI-Nspire
      • How to find Solving Equations on TI-Nspire
      • How to find Graphing Functions on TI-Nspire
      • How to find Integrals on TI-Nspire
      • How to find Derivatives on TI-Nspire
      • How to find Summation on TI-Nspire
      • How to find Factorial on TI-Nspire
      • How to find Combinations and Permutations on TI-Nspire
      • How to find Z-Score on TI-Nspire
      • How to find Probability Distributions on TI-Nspire
      • How to find ANOVA on TI-Nspire
      • How to find Histograms on TI-Nspire
      • How to find Box-and-Whisker Plots on TI-Nspire
      • How to find Present and Future Value on TI-Nspire
      • How to find Confidence Intervals on TI-Nspire
      • Population Standard Deviation and Sample Standard Deviation
    • Correlation Calculator >
      • Covariance vs. Correlation
    • Dice Roller
    • Probability Distribution Calculator
    • Interquartile Range Calculator
    • Empirical Rule Calculator
    • Mean, Median and Mode Calculator
    • Average Calculator
    • Linear Regression Calculator
    • Sample Size Calculator
    • Other Statistical Tables >
      • T Value Table
      • Chi-Square Table
      • F Distribution Table
    • Standard Deviation Calculator
    • Standard Deviation Problems
    • Normal vs Non-Normal Distribution: Understanding the Differences
    • Covariance vs. Variance: Understanding the Differences
    • Explanatory Variable: Understanding Its Role in Statistical Analysis
    • Independent variable vs dependent
    • What is a Residual in Statistics?
    • Left Skewed vs. Right Skewed Distributions
    • How to Find Variance on ti 84
    • Real Life Examples of Correlation
    • What is Regression Analysis?
    • Statistics Forum
  • Math
    • Combination Calculator
    • How to Calculate a Combination
    • Combination Formula in Statistics
    • Permutation Calculator
    • Distance Between Two Points Calculator
    • Exploring 7 Unsolvable Math Problems >
      • Riemann Hypothesis
    • Math Problems >
      • Math Problems for 1st Graders
      • Math Problems for 2nd Graders
      • Math Problems for 3rd Graders
      • Math Problems for 4th Graders
      • Math Problems for 5th Graders
      • Math Problems for 6th Graders
      • Math Problems for 7th Graders
      • Math Problems for 8th Graders
      • Math Problems for 9th Graders
      • Math Problems for 10th Graders
      • Math Problems for 11th Graders
    • Times Tables >
      • 1 Times Table
      • 2 Times Table
      • 3 Times Table
      • 4 Times Table
      • 5 Times Table
      • 6 Times Table
      • 7 Times Table
      • 8 Times Table
      • 9 Times Table
      • 10 Times Table
    • Multiplication Tables >
      • Multiplication Table by 20
      • Multiplication Table by 19
      • Multiplication Table by 18
      • Multiplication Table by 17
      • Multiplication Table by 16
      • Multiplication Table by 15
      • Multiplication Table by 14
      • Multiplication Table by 13
      • Multiplication Table by 12
      • Multiplication Table by 11
      • Multiplication Table by 10
      • Multiplication Table by 9
      • Multiplication Table by 8
      • Multiplication Table by 7
      • Multiplication Table by 6
      • Multiplication Table by 5
      • Multiplication Table by 4
      • Multiplication Table by 3
    • Roman Numerals Chart
    • Roman Numerals >
      • Roman Numerals Converter
      • I Roman Numerals
      • II Roman Numerals
      • III Roman Numerals
      • IV Roman Numerals
      • V Roman Numerals
      • VI Roman Numerals
      • VII Roman Numerals
      • VIII Roman Numerals
      • IX Roman Numerals
      • X Roman Numerals
      • XI Roman Numerals
      • XII Roman Numerals
      • XIII Roman Numerals
      • XIV Roman Numerals
      • XV Roman Numerals
      • XVI Roman Numerals
      • XVII Roman Numerals
      • XVIII Roman Numerals
      • LXVI Roman Numerals
      • LXVII Roman Numerals
      • LXVIII Roman Numerals
      • LXIX Roman Numerals
      • LXX Roman Numerals
      • LXXI Roman Numerals
      • LXXII Roman Numerals
      • LXXIII Roman Numerals
      • LXXIV Roman Numerals
      • LXXV Roman Numerals
      • LXXVI Roman Numerals
      • LXXVII Roman Numerals
      • LXXVIII Roman Numerals
      • LXXIX Roman Numerals
      • LXXX Roman Numerals
      • LXXXI Roman Numerals
      • LXXXII Roman Numerals
      • LXXXIII Roman Numerals
      • LXXXIV Roman Numerals
      • LXXXV Roman Numerals
      • LXXXVI Roman Numerals
      • LXXXVII Roman Numerals
      • LXXXVIII Roman Numerals
      • LXXXIX Roman Numerals
      • XC Roman Numerals
      • XCI Roman Numerals
      • XCII Roman Numerals
      • XCIII Roman Numerals
      • XCIV Roman Numerals
      • XCV Roman Numerals
      • XCVI Roman Numerals
      • XCVII Roman Numerals
      • XCVIII Roman Numerals
      • XCIX Roman Numerals
      • C Roman Numerals
      • CI Roman Numerals
      • CII Roman Numerals
      • CIII Roman Numerals
      • CIV Roman Numerals
      • CV Roman Numerals
      • CVI Roman Numerals
      • CVII Roman Numerals
      • CVIII Roman Numerals
      • CIX Roman Numerals
      • CX Roman Numerals
      • CXI Roman Numerals
      • CXII Roman Numerals
      • CXIII Roman Numerals
      • CXIV Roman Numerals
      • CXV Roman Numerals
      • CXVI Roman Numerals
      • CXVII Roman Numerals
      • CXVIII Roman Numerals
      • CXIX Roman Numerals
      • CXX Roman Numerals
      • CXXI Roman Numerals
      • CXXII Roman Numerals
      • CXXIII Roman Numerals
      • CXXIV Roman Numerals
      • CXXV Roman Numerals
      • CXXVI Roman Numerals
      • CXXVII Roman Numerals
      • CXXVIII Roman Numerals
      • CXXIX Roman Numerals
      • CXXX Roman Numerals
      • CXXXI Roman Numerals
      • CXXXII Roman Numerals
      • CXXXIII Roman Numerals
      • CXXXIV Roman Numerals
      • CXXXV Roman Numerals
      • CXXXVI Roman Numerals
      • CXXXVII Roman Numerals
      • CXXXVIII Roman Numerals
      • CXXXIX Roman Numerals
      • CXL Roman Numerals
      • CXLI Roman Numerals
      • CXLII Roman Numerals
      • CXLIII Roman Numerals
      • CXLIV Roman Numerals
      • CXLV Roman Numerals
      • CXLVI Roman Numerals
      • CXLVII Roman Numerals
      • CXLVIII Roman Numerals
      • CXLIX Roman Numerals
      • CL Roman Numerals
      • CLI Roman Numerals
      • CLII Roman Numerals
      • CLIII Roman Numerals
      • CLIV Roman Numerals
      • CLV Roman Numerals
      • CLVI Roman Numerals
      • CLVII Roman Numerals
      • CLVIII Roman Numerals
      • CLIX Roman Numerals
      • CLX Roman Numerals
      • CLXI Roman Numerals
      • CLXII Roman Numerals
      • CLXIII Roman Numerals
      • CLXIV Roman Numerals
      • CLXV Roman Numerals
      • CLXVI Roman Numerals
      • CLXVII Roman Numerals
      • CLXVIII Roman Numerals
      • CLXIX Roman Numerals
      • CLXX Roman Numerals
      • CLXXI Roman Numerals
      • CLXXII Roman Numerals
      • CLXXIII Roman Numerals
      • CLXXIV Roman Numerals
      • CLXXV Roman Numerals
      • CLXXVI Roman Numerals
      • CLXXVII Roman Numerals
      • CLXXVIII Roman Numerals
      • CLXXIX Roman Numerals
      • CLXXX Roman Numerals
      • CLXXXI Roman Numerals
      • CLXXXII Roman Numerals
      • CLXXXIII Roman Numerals
      • CLXXXIV Roman Numerals
      • CLXXXV Roman Numerals
      • CLXXXVI Roman Numerals
      • CLXXXVII Roman Numerals
      • CLXXXVIII Roman Numerals
      • CLXXXIX Roman Numerals
      • CXC Roman Numerals
      • CXCI Roman Numerals
      • CXCII Roman Numerals
      • CXCIII Roman Numerals
      • CXCIV Roman Numerals
      • CXCV Roman Numerals
      • CXCVI Roman Numerals
      • CXCVII Roman Numerals
      • CXCVIII Roman Numerals
      • CXCIX in Roman Numerals
      • CC Roman Numerals
      • 3 in Roman Numerals
      • 4 in Roman Numerals
      • 5 in Roman Numerals
      • 6 in Roman Numerals
      • 7 in Roman Numerals
      • 8 in Roman Numerals
      • 9 in Roman Numerals
      • 10 in Roman Numerals
      • 11 in Roman Numerals
      • 12 in Roman Numerals
      • 13 in Roman Numerals
      • 14 in Roman Numerals
      • 15 in Roman Numerals
      • 16 in Roman Numerals
      • 18 in Roman Numerals
      • 19 in Roman Numerals
      • 20 in Roman Numerals
      • 22 in Roman Numerals
      • 30 in Roman Numerals
      • 50 in Roman Numerals
      • 100 in Roman Numerals
      • 500 in Roman Numerals
      • 1000 in Roman Numerals
      • SAMPLE >
        • TEMP XVII Roman Numerals
    • Percentage Increase Calculator
    • Linear Equations >
      • Two-Variable Linear Equations Test with Answers
      • One Variable Linear Equations >
        • Ax=B Linear Equation Calculator
        • Ax=B Linear Equation Practice Test
    • Decimal Places Value Chart
    • Cone Volume Calculator
    • Circumference Calculator
    • Rounding Calculator >
      • Round 15 to the nearest ten
      • Round 75 to the nearest ten
      • Round 35 to the nearest ten
      • Round 5 to the nearest ten
      • Round 3 to the Nearest Ten
    • Factor Calculator >
      • Factor of 36
      • Factor of 30
      • Factor of 32
      • Factor of 35
      • Factor of 39
      • Factor of 33
      • Factor of 34
      • Factor of 3
      • Factor of 3/4
      • Factor of 38
    • Radius of a Circle
    • Fraction Calculator
    • Perfect Square Calculator >
      • Is 1 a perfect square
      • Is 2 a perfect square
      • Is 8 a perfect square
      • Is 9 a perfect square
      • Is 16 a perfect square
      • Is 20 a perfect square
      • Is 36 a perfect square
      • Is 49 a perfect square
      • Is 81 a perfect square
      • Is 125 a perfect square
    • Random Number Generator >
      • Random and Pseudorandom Numbers
      • What is Random Number
    • Horizontal Line
    • X and Y Axis
    • Margin Calculator
    • Simple Interest Calculator
    • Sig Fig Calculator
    • Right Triangle Calculator
    • Money Counter
    • Root Calculator
    • Table of Square Roots
    • Square Root Calculator >
      • Square root of 2
      • Square root of 8
      • Square root of 5
      • Square root of 4
      • Square root of 3
      • Square root of 64
      • Square root of 10
      • Square root of 16
      • Square root of 25
      • Square root of 12
      • Square root of 50
      • Square root of 20
      • Square root of 9
      • Square root of 100
      • Square root of 36
      • Square root of 6
      • Square root of 49
      • Square root of 1
      • Square root of 32
      • Square root of 40
      • Square root of 81
      • Square root of 18
      • Square root of 72
      • Square root of 13
      • Square root of 80
      • Square root of 45
    • Log Calculator
    • Inequality Symbols
    • Exponent calculator
    • Decimal to Fraction Calculator
    • Fraction to Percent Calculator
    • Scale Factor
  • Unit Conversion
    • Celsius to Fahrenheit Converter >
      • -40 C to F
      • 10 C to F
      • 15 C to F
      • 22 C to F
      • 30 C to F
      • 37 C to F
      • 40 C to F
    • Fahrenheit to Celsius Converter >
      • -40 F to C
      • 17 Fahrenheit to Celsius
      • 18 Fahrenheit to Celsius
      • 19 Fahrenheit to Celsius
      • 20 Fahrenheit to Celsius
      • 23 Fahrenheit to Celsius
      • 26 Fahrenheit to Celsius
      • 27 Fahrenheit to Celsius
      • 28 Fahrenheit to Celsius
      • 37 Fahrenheit to Celsius
      • 40 F to C
      • 60 F to C
      • 68 F to C
      • 69 F to C
      • 70 F to C
      • 72 F to C
      • 75 F to C
      • 80 F to C
      • 90 F to C
      • 100 F to C
      • 180 F to C
      • 220 F to C
      • 350 F to C
    • Weight conversion table kg to lbs
    • Kilograms to Pounds Converter >
      • 1 kg to lbs
      • 2 kg to lbs
      • 3 kg to lbs
      • 4 kg to lbs
      • 6 kg to lbs
      • 8 kg to lbs
      • 10 kg to lbs
      • 12 kg to lbs
      • 15 kg to lbs
      • 16 kg to lbs
      • 20 kg to lbs
      • 23 kg to lbs
      • 25 kg to lbs
      • 30 kg to lbs
      • 40 kg to lbs
      • 45 kg to lbs
      • 50 kg to lbs
      • 53 kg to lbs
      • 56 kg to lbs
      • 57 kg to lbs
      • 58 kg to lbs
      • 59 kg to lbs
      • 60 kg to lb
      • 62 kg to lbs
      • 63 kg to lbs
      • 64 kg to lbs
      • 65 kg to lbs
      • 67 kg to lbs
      • 68 kg to lbs
      • 70 kg to lbs
      • 72 kg to lbs
      • 73 kg to lbs
      • 74 kg to lbs
      • 75 kg to lbs
      • 76 kg to lbs
      • 78 kg to lbs
      • 80 kg to lbs
      • 82 kg to lbs
      • 84 kg to lbs
      • 85 kg to lbs
      • 90 kg to lbs
      • 95 kg to lbs
      • 150 kg to lbs
      • 100 kg to lbs
    • Pounds to Kilograms Converter >
      • 1-10 LB to KG >
        • 1.25 lb to kg
        • 2.25 lb to kg
        • 3.75 lb to kg
        • 1.75 lb to kg
        • 1.56 lb to kg
        • 5.25 lb to kg
        • 2.75 lb to kg
        • 1.87 lb to kg
        • 1.65 lb to kg
        • 2.87 lb to kg
        • 0.75 lb to kg
        • 0.75 lb to kg
        • 1.1 lb to kg
        • 1.21 lb to kg
        • 1.32 lb to kg
        • 3.25 lb to kg
        • 1.55 lb to kg
        • 2.65 lb to kg
        • 1.37 lb to kg
        • 0.55 lb to kg
        • 1.85 lb to kg
        • 2.15 lb to kg
        • 1.14 lb to kg
        • 3.31 lb to kg
        • 0.88 lb to kg
        • 1.15 lb to kg
        • 5.29 lb to kg
        • 0.45 lb to kg
        • 4.75 lb to kg
        • 0.85 lb to kg
        • 0.95 lb to kg
        • 5.11 lb to kg
        • 0.44 lb to kg
        • 1.82 lb to kg
        • 2.85 lb to kg
        • 0.68 lb to kg
        • 1.13 lb to kg
        • 0.05 lb to kg
        • 2.47 lb to kg
        • 3.85 lb to kg
        • 4.23 lb to kg
        • 1.38 lb to kg
        • 2.91 lb to kg
        • 4.12 lb to kg
        • 2.95 lb to kg
        • 5.73 lb to kg
        • 2.99 lb to kg
        • 1.78 lb to kg
        • 3.35 lb to kg
        • 1.92 lb to kg
        • 1.58 lb to kg
        • 5.51 lb to kg
        • 1.28 lb to kg
        • 0.02 lb to kg
        • 1.42 lb to kg
        • 0.89 lb to kg
        • 1.16 lb to kg
        • 1.99 lb to kg
        • 1.69 lb to kg
        • 2.17 lb to kg
        • 1 lb to kg
        • 1.6 lb to kg
        • 2 lb to kg
        • 3 lb to kg
        • 4 lb to kg
        • 5 lb to kg
        • 6 lb to kg
        • 7 lb to kg
        • 8 lb to kg
        • 9 lb to kg
        • 10 lb to kg
      • 11 lb to kg
      • 12 lb to kg
      • 12.5 lb to kg
      • 13 lb to kg
      • 14 lb to kg
      • 15 lb to kg
      • 16 lb to kg
      • 17 lb to kg
      • 18 lb to kg
      • 19 lb to kg
      • 20 lb to kg
      • 21 lb to kg
      • 22 lb to kg
      • 23 lb to kg
      • 24 lb to kg
      • 25 lb to kg
      • 26 lb to kg
      • 27 lb to kg
      • 28 lb to kg
      • 29 lb to kg
      • 30 lb to kg
      • 31 lb to kg
      • 32 lb to kg
      • 33 lb to kg
      • 35 lb to kg
      • 40 lb to kg
      • 45 lb to kg
      • 50 lb to kg
      • 55 lb to kg
      • 60 lb to kg
      • 70 lb to kg
      • 90 lb to kg
      • 98 lb to kg
      • 99 lb to kg
      • 100 lb to kg
      • 130 lb to kg
      • 150 lb to kg
    • Fluid Ounces to Milliliters
    • Kilometers to Miles Converter >
      • 1 kilometer to miles
      • 5 km to miles
      • 10 km to miles
      • 15 km to miles
      • 20 km to miles
      • 50 km to miles
      • 100 km to miles
    • Miles to Kilometers Conversion >
      • 1 mile to kilometers
      • 5 miles to km
      • 10 miles to km
      • 15 miles to km
      • 20 miles to km
    • KPH to MPH Converter >
      • 30 kph to mph
      • 45 kph to mph
      • 60 kph to mph
      • 70 kph to mph
      • 75 kph to mph
      • 90 kph to mph
      • 100 kph to mph
      • 110 kph to mph
      • 120 kph to mph
      • 130 kph to mph
      • 140 kph to mph
      • 150 kph to mph
      • 155 kph to mph
      • 160 kph to mph
      • 165 kph to mph
      • 180 kph to mph
      • 200 kph to mph
      • 210 kph to mph
      • 220 kph to mph
      • 240 kph to mph
      • 250 kph to mph
      • 260 kph to mph
      • 270 kph to mph
      • 280 kph to mph
      • 300 kph to mph
      • 320 kph to mph
      • 360 kph to mph
      • 400 kph to mph
      • 600 kph to mph
      • 800 kph to mph
    • Inches to Millimeters Converter >
      • 1 inch to mm
      • 1.5 inches to mm
      • 2 inches to mm
      • 2.5 inches to mm
      • 3 inches to mm
      • 4 inches to mm
      • 5 inches to mm
      • 6 inches to mm
      • 18 inches to mm
      • 34 inches to mm
      • 160 inches to mm
    • Millimeters to Inches Converter >
      • 1 mm to inches
      • 1.5 mm to inches
      • 2 mm to inches
      • 2.5 mm to inches
      • 3 mm to inches
      • 3.5 mm to inches
      • 4 mm to inches
      • 4.5 mm to inches
      • 5 mm to inches
      • 6 mm to inches
      • 8 mm to inches
      • 10 mm to inches
    • Meters to Feet Converter >
      • 1 Meter to Feet
      • 2 Meters to Feet
      • 3 Meters to Feet
      • 5 Meters to Feet
      • 10 Meters to Feet
      • 20 Meters to Feet
      • 30 Meters to Feet
      • 50 Meters to Feet
      • 100 Meters to Feet
    • Centimeters to Inches Converter >
      • 2 cm to inches
      • 3 cm to inches
      • 5 cm to inches
      • 8 cm to inches
      • 10 cm to inches
      • 12 cm to inches
      • 14 cm to inches
      • 15 cm to inches
      • 17 cm to inches
      • 18 cm to inches
      • 20 cm to inches
      • 21 cm to inches
      • 25 cm to inches
      • 28 cm to inches
      • 30 cm to inches
      • 35 cm to inches
      • 40 cm to inches
      • 50 cm to inches
      • 60 cm to inches
      • 36 cm to inches
      • 45 cm to inches
      • 70 cm to inches
      • 80 cm to inches
      • 90 cm to inches
      • 100 cm to inches
      • 120 cm to inches
      • 150 cm to inches
    • Centimeters to Feet Converter >
      • 150 cm to feet
      • 160 cm to feet
      • 162 cm to feet
      • 163 cm to feet
      • 164 cm to feet
      • 165 cm to feet
      • 170 cm to feet
      • 172 cm to feet
      • 173 cm to feet
      • 175 cm to feet
      • 178 cm to feet
      • 180 cm to feet
      • 182 cm to feet
      • 183 cm to feet
      • 185 cm to feet
      • 190 cm to feet
    • Watts to Amps Calculator >
      • 500 Watts to Amps
      • 800 Watts to Amps
      • 1000 Watts to Amps
      • 1200 Watts to Amps
      • 1500 Watts to Amps
      • 2500 Watts to Amps
      • 3000 Watts to Amps
      • 5000 Watts to Amps
    • MCG to MG Converter >
      • 5 mcg to mg
      • 10 mcg to mg
      • 50 mcg to mg
      • 100 mcg to mg
      • 125 mcg to mg
      • 200 mcg to mg
      • 250 mcg to mg
      • 300 mcg to mg
      • 400 mcg to mg
      • 500 mcg to mg
      • 1000 mcg to mg
  • Date & Time
    • Time Duration Calculator
    • Time Conversion Chart
    • Military Times Chart
    • Military Time Now Clock
    • Military Time Converter
    • GMT Time Clock
    • Time Zone
    • Age Calculator
  • Test Prep
    • CFA Exam Overview >
      • How to Prepare for CFA level 1: An Actionable Study Guide
      • 20 CFA Level 1 Practice Questions
      • CFA Practice Questions for level 1
      • 30 CFA Level 1 Practice Questions
      • CFA Level 2 Practice Exam Questions
      • CFA Sample Practice Questions | Level 3| Answers and Explanations
      • CFA Exam Requirements
      • CFA Level 3 Salary
    • SAT Practice Test Math
    • Math Practice Test HiSET
    • Acing the SAT: A Comprehensive and Actionable Study Guide
    • GMAT Practice Questions Math with Answers and Explanations
    • GMAT Math Formulas Sheet
    • Math Practice Test for GED with Answers and Explanations
    • Math Problems to Solve | Practice Test
    • Free Practice TEAS Test
    • ​GRE Practice Math Questions | Free | Answers & Explanations
    • Formulas for GRE Math Section
    • ACT Practice Test with Answers and Explanations
    • CPA Practice Questions
    • ASVAB Practice Test
    • IQ Test
    • How many hours to study for CPA
    • How to Excel in Your CPA Exams: A Comprehensive Preparation Guide
  • Blog
  • Contact Us
    • Advertise Here
    • Privacy Policy
    • Useful Calculators and Converters
  • Español
    • XVIII Roman Numerals
    • XIX Roman Numerals
    • XX Roman Numerals
    • XXI Roman Numerals
    • XVIII Roman Numerals
    • XXII Roman Numerals
    • XXIII Roman Numerals
    • XXIV Roman Numerals
    • XXV Roman Numerals
    • XXVI Roman Numerals
    • XXVII Roman Numerals
    • XXVIII Roman Numerals
    • XXIX Roman Numerals
    • XXX Roman Numerals
    • XXXI Roman Numerals
    • XXXII Roman Numerals
    • XXXIII Roman Numerals
    • XXXIV Roman Numerals
    • XXXV Roman Numerals
    • XXXVI Roman Numerals
    • XXXVII Roman Numerals
    • XXXVIII Roman Numerals
    • XXXIX Roman Numerals
    • XL Roman Numerals
    • XLI Roman Numerals
    • XLII Roman Numerals
    • XLIII Roman Numerals
    • XLIV Roman Numerals
    • XLV Roman Numerals
    • XLVI Roman Numerals
    • XLVII Roman Numerals
    • XLVIII Roman Numerals
    • XLIX Roman Numerals
    • L Roman Numerals
    • LI Roman Numerals
    • LII Roman Numerals
    • LIII Roman Numerals
    • LIV Roman Numerals
    • LV Roman Numerals
    • LVI Roman Numerals
    • LVII Roman Numerals
    • LVIII Roman Numerals
    • LIX Roman Numerals
    • LX Roman Numerals
    • LXI Roman Numerals
    • LXII Roman Numerals
    • LXIII Roman Numerals
    • LXIV Roman Numerals
    • LXV Roman Numerals
    • XVIII Roman Numerals
    • TEMP XVII Roman Numerals
    • XVIII Roman Numerals >
      • TEMP XVII Roman Numerals
  • Mole Calculator
  • BMI Calculator
  • Tic Tac Toe
  • 100s Chart -Printable
  • Online Timer
  • Online Stopwatch
  • How Many Days Until Chritmas
  • ​Simple Interest Formula Explained
  • Understanding Simple Interest vs. Compound Interest
  • 10 Real-World Simple Interest Examples
  • 20 Simple Interest Problems
  • Compound Interest Practice Problems
  • 34 lb to kg
  • 36 lb to kg
  • 37 lb to kg
  • 38 lb to kg
  • 39 lb to kg
  • 41 lb to kg
  • 42 lb to kg
  • 43 lb to kg
  • 44 lb to kg
  • 46 lb to kg
  • 47 lb to kg
  • 48 lb to kg
  • 49 lb to kg
  • 51 lb to kg
  • 52 lb to kg
  • 53 lb to kg
  • 54 lb to kg
  • 56 lb to kg
  • 57 lb to kg
  • 58 lb to kg
  • 59 lb to kg
  • 61 lb to kg
  • 62 lb to kg
  • 63 lb to kg
  • 64 lb to kg
  • 65 lb to kg

How to Calculate the Z Score: A Comprehensive Guide

In the world of statistics, it's essential to know how to compare different data points and understand how far they deviate from the average. One useful tool for this purpose is the Z score. In this comprehensive guide, we will delve into the concept of the Z score, explain why it is important, and provide a step-by-step guide on how to calculate it. By the end of this blog post, you will have a solid understanding of Z scores, their applications, and how to interpret them. If you quickly need to calculate a z score or a z score probability please check out:
  • Z Score Table & Z Score Calculator
  • Z Score Probability Calculator

Definition of Z score


The Z score, also known as the standard score, is a measure that expresses the number of standard deviations a data point is away from the mean (average) of a dataset. It is a dimensionless quantity that enables us to compare data points from different distributions or scales.

To better understand the Z score, let's break down its components:
  1. Standard deviation: This is a measure of the spread or dispersion of a dataset. It tells us how much the individual data points deviate from the mean, on average. The greater the standard deviation, the more dispersed the data points are from the mean.
  2. Mean: The mean, or average, is the sum of all data points divided by the number of data points. It represents the central value of a dataset.
The Z score essentially calculates how many standard deviations away a particular data point is from the mean of the dataset. This is useful for understanding how unusual or typical a data point is within the context of the dataset.

For example, consider the following dataset of ages of a group of people: {20, 25, 30, 35, 40, 45, 50}. The mean age is 35, and the standard deviation is approximately 10.07. To calculate the Z score for the age of 45, we would use the formula:

Z score = (Data point - Mean) / Standard deviation
Z score = (45 - 35) / 10.07 ≈ 0.99

In this case, the Z score of 0.99 indicates that the age of 45 is approximately one standard deviation above the mean age of the group. This suggests that the age of 45 is relatively common within the dataset, as it is close to the average value.
On the other hand, if we calculate the Z score for the age of 20:

Z score = (20 - 35) / 10.07 ≈ -1.49

The negative Z score of -1.49 indicates that the age of 20 is approximately 1.5 standard deviations below the mean age of the group. This suggests that the age of 20 is less common within the dataset, as it is farther away from the average value.
z score formula

Importance of Z score in statistics

Z scores are widely used in statistics because they provide a standardized way of comparing data points, regardless of the original scale. They are particularly helpful in identifying outliers, standardizing data for analysis, and comparing data from different sources.

​Applications of Z score

  1. Comparing data from different scales: Z scores allow us to compare data points from different distributions or scales, such as test scores or financial data, by standardizing the data.
  2. Identifying outliers: Z scores can help determine whether a data point is an outlier, as unusually high or low Z scores suggest that the data point significantly deviates from the mean.
  3. Standardizing data for analysis: Z scores are often used in statistical analyses, such as regression and hypothesis testing, to ensure that the data is on a common scale.

Prerequisites for calculating Z score

Understanding the normal distribution
  1. Definition and characteristics: The normal distribution, also known as the Gaussian distribution, is a continuous probability distribution characterized by its bell-shaped curve. It is symmetric around the mean, with the majority of data points concentrated near the mean and fewer data points as we move away from the mean.
  2. The bell curve: The bell curve is a visual representation of the normal distribution. It is called a bell curve because of its bell-like shape, with the peak corresponding to the mean, and the tails extending towards infinity in both directions.

Familiarity with basic statistical concepts

To calculate Z scores, you need to have a basic understanding of the following statistical concepts:
  1. Mean: The mean, or average, is the sum of all data points divided by the number of data points. It is a measure of central tendency that provides an idea of where the center of the dataset lies.
  2. Standard deviation: The standard deviation is a measure of the dispersion or spread of a dataset. It indicates how much the individual data points deviate from the mean on average.
  3. Variance: Variance is the square of the standard deviation. It represents the average of the squared differences between each data point and the mean.
how to calculate the z score

Step-by-step guide to calculating Z score

To calculate the Z score, follow these steps:

Step 1: Identify the data point

First, you need to identify the data point for which you want to calculate the Z score. This data point could be a test score, a financial figure, or any other value you wish to compare with the rest of the dataset.

Step 2: Calculate the mean of the dataset

Next, calculate the mean (average) of the dataset by adding up all the data points and dividing the sum by the number of data points.

Step 3: Calculate the standard deviation of the dataset

To calculate the standard deviation of the dataset, follow these steps:
  1. Subtract the mean from each data point and square the result.
  1. Add up all the squared differences obtained in the previous step.
  2. Divide the sum of the squared differences by the number of data points (or by one less than the number of data points if using a sample rather than a population).
  3. Take the square root of the result to obtain the standard deviation.
 
Step 4: Compute the Z score using the formula
 
Now that you have the mean and standard deviation, you can calculate the Z score using the following formula:
 
Z score = (Data point - Mean) / Standard deviation
 
The Z score formula expresses the distance between the data point and the mean in terms of standard deviations. A positive Z score indicates that the data point is above the mean, while a negative Z score indicates that it is below the mean. A Z score of zero means that the data point is equal to the mean.
 
Example with detailed calculations:

Suppose we have the following test scores for a group of students: 72, 84, 90, 66, 78, 96, and 82. We want to calculate the Z score for the test score of 90. First, we calculate the mean and standard deviation of the dataset:
 
Mean = (72 + 84 + 90 + 66 + 78 + 96 + 82) / 7 = 668 / 7 = 95.43 (rounded to two decimal places)
 
Standard deviation:
   a. Subtract the mean from each data point and square the result:
      (72 - 95.43)^2 = 547.90
      (84 - 95.43)^2 = 131.04
      (90 - 95.43)^2 = 29.58
      (66 - 95.43)^2 = 863.04
      (78 - 95.43)^2 = 303.80
      (96 - 95.43)^2 = 0.32
      (82 - 95.43)^2 = 181.04
   b. Add up all the squared differences: 547.90 + 131.04 + 29.58 + 863.04 + 303.80 + 0.32 + 181.04 = 2,056.72
   c. Divide the sum of squared differences by the number of data points (or by one less than the number of data points if using a sample): 2,056.72 / 7 = 293.82
   d. Take the square root of the result: √293.82 = 17.14 (rounded to two decimal places)
 
Finally, we can calculate the Z score for the test score of 90:
 
Z score = (90 - 95.43) / 17.14 = -0.32 (rounded to two decimal places)
 
This means that the test score of 90 is 0.32 standard deviations below the mean.

Interpretation of Z scores

What a positive, negative, or zero Z score indicates

A positive Z score indicates that the data point is above the mean, a negative Z score indicates that it is below the mean, and a zero Z score means that the data point is equal to the mean.
 
Z score as a measure of distance from the mean

The Z score tells us how far a data point is from the mean in terms of standard deviations. A Z score of 1, for example, indicates that the data point is one standard deviation above the mean, while a Z score of -2 indicates that it is two standard deviations below the mean.

Standard deviations and percentiles
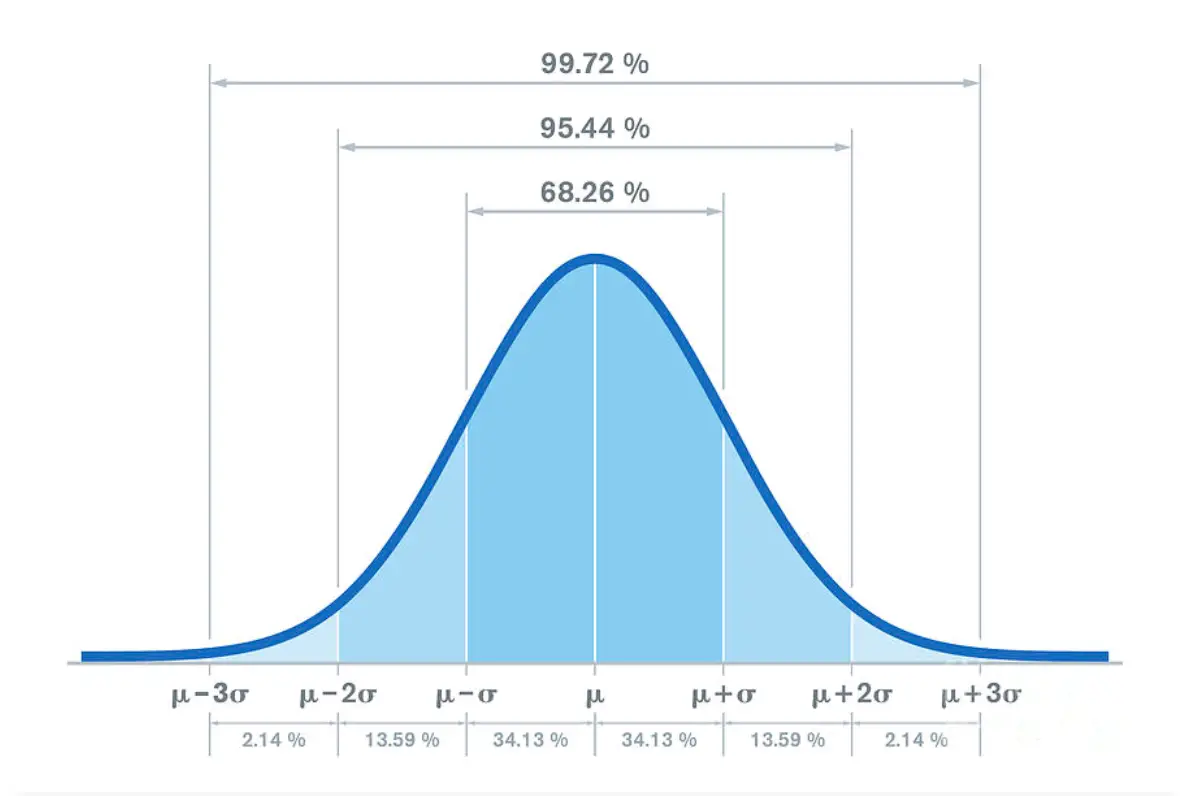
  1. One, two, and three standard deviation rules: In a normal distribution, approximately 68% of the data points fall within one standard deviation of the mean, 95% within two standard deviations, and 99.7% within three standard deviations. These rules help us determine the probability of a data point falling within a specific range in relation to the mean.
  2. Using Z score to determine percentiles: The Z score can be used to find the percentile rank of a data point in a dataset. Percentile rank represents the percentage of data points that fall below a given data point. To find the percentile rank, you can use a Z score table or an online calculator that provides the area under the curve to the left of the Z score.

Applications of Z scores in real life

Comparing test scores and student performance: Z scores are often used to compare students' test scores from different schools or standardized tests, making it easier to evaluate student performance and identify areas where improvement is needed.
​
Financial data analysis and risk management: Z scores can help analysts and investors compare financial data from different companies, industries, or time periods, enabling them to make more informed decisions. They can also be used to assess the risk associated with investments, such as the likelihood of a stock price falling within a certain range.

Quality control in manufacturing: In manufacturing, Z scores can be used to monitor product quality and identify any deviations from the established standards. By detecting outliers, manufacturers can take corrective action to ensure that products meet the desired quality standards.

Limitations of Z scores

Applicability only for normally distributed data: Z scores are most accurate when the data follows a normal distribution. If the data is not normally distributed, the Z score may not accurately represent the position of a data point within the dataset.
Inaccuracy when dealing with small sample sizes: Z scores can be less accurate when dealing with small sample sizes, as the standard deviation may not be a reliable measure of dispersion.

Potential misuse in data manipulation: While Z scores can be helpful in identifying outliers and standardizing data for analysis, they can also be misused to manipulate data or draw inaccurate conclusions.

How to Calculate the Z Score using a TI-89 Calculator

The TI-89 calculator is a powerful and versatile tool that can help you quickly and easily calculate Z scores. In this section, we will explain how to calculate the Z score using a TI-89 calculator, which can save you time and effort when working with statistical data. 
Step-by-step guide to calculating Z score on a TI-89 calculator:

Input your dataset:

Before you can calculate a Z score on your TI-89 calculator, you need to input your dataset. Follow these steps:
a. Turn on the calculator and press the 'APPS' button. b. Scroll down the list of available applications and select '6: Data/Matrix Editor'. c. Choose '3: New' to create a new dataset. d. In the 'Type' field, select 'Data' and provide a suitable name for your dataset in the 'Var' field. Press 'Enter' to create the dataset. e. Now, input your data points into the 'c1' column. You can navigate using the arrow keys and input values by typing the numbers and pressing 'Enter'.

Calculate the mean and standard deviation:

a. Press the '2nd' button, followed by the '5' button to access the 'List' menu. b. Scroll down and select '3: mean(' and then select the dataset you created earlier by pressing '2nd', 'VAR-LINK', and choosing the dataset. Close the parenthesis and press 'Enter' to calculate the mean. c. To calculate the standard deviation, repeat the process, but select '7: stdDev(' from the 'List' menu instead. Enter the dataset name, close the parenthesis, and press 'Enter'.

Take note of the mean and standard deviation values, as you will need them to calculate the Z score.

Calculate the Z score:

To calculate the Z score for a specific data point, use the following formula:

Z score = (Data point - Mean) / Standard deviation
​

a. Press the 'Home' button to return to the main screen. b. Input the data point you want to calculate the Z score for, followed by the subtraction operator '-'. c. Input the mean value you calculated earlier and press 'Enter' to calculate the difference between the data point and the mean. d. Divide the result by the standard deviation value you calculated earlier, using the division operator '/'. e. Press 'Enter' to calculate the Z score for the data point.

How to Calculate a Z Score in Excel and Google Sheets

Calculating the Z score in Excel or Google Sheets is a straightforward process that can help you quickly analyze and compare data points within a dataset. We will guide you through the steps to calculate a Z score in both Excel and Google Sheets.
Step-by-step guide to calculating Z score in Excel and Google Sheets:
  1. Input your dataset:
Create a new spreadsheet in either Excel or Google Sheets, and input your dataset into a single column or row. For our example, we will input the dataset into column A, starting from cell A1.
  1. Calculate the mean:
To calculate the mean of your dataset, use the AVERAGE function. In an empty cell, type the following formula:
=AVERAGE(A1:A[n])
Replace 'A[n]' with the last cell in the range containing your dataset. Press 'Enter' to calculate the mean. For example, if your dataset ends at cell A7, the formula would be:
=AVERAGE(A1:A7)
  1. Calculate the standard deviation:
To calculate the standard deviation of your dataset, use the STDEV.S (for a sample) or STDEV.P (for a population) function in Excel, and the STDEV (for a sample) or STDEVP (for a population) function in Google Sheets. In an empty cell, type the following formula:
=STDEV.S(A1:A[n]) (Excel) or =STDEV(A1:A[n]) (Google Sheets)
Replace 'A[n]' with the last cell in the range containing your dataset, and press 'Enter' to calculate the standard deviation.
  1. Calculate the Z score:
To calculate the Z score for a specific data point, use the following formula:
Z score = (Data point - Mean) / Standard deviation
In an empty cell adjacent to the data point you want to calculate the Z score for, type the following formula:
=(A1 - Mean_Cell) / Stdev_Cell
Replace 'A1' with the cell containing the data point, 'Mean_Cell' with the cell containing the mean value, and 'Stdev_Cell' with the cell containing the standard deviation value. Press 'Enter' to calculate the Z score for the data point.
  1. Calculate Z scores for all data points (optional):
If you want to calculate Z scores for all data points in your dataset, you can copy the formula from the previous step and paste it into the adjacent cells. Be sure to use absolute cell references (by adding dollar signs before the column and row identifiers) for the mean and standard deviation cells to avoid errors when copying the formula. For example:
=(A1 - $B$1) / $B$2
Now you have successfully calculated the Z score for your data points using Excel or Google Sheets!
Bottom of Form

How to Calculate a Z Score in R and Python

Calculating the Z score in R and Python is an essential skill for anyone working with statistical data in these popular programming languages. Here we will guide you through the steps to calculate a Z score in both R and Python.
Calculating Z Score in R:
  1. Input your dataset:
Create a vector in R containing your dataset. For example, if you have the dataset {20, 25, 30, 35, 40, 45, 50}, you can create a vector as follows:
RCopy code
data <- c(20, 25, 30, 35, 40, 45, 50)
  1. Calculate the mean and standard deviation:
Use the mean() and sd() functions in R to calculate the mean and standard deviation of your dataset:
RCopy code
mean_data <- mean(data) sd_data <- sd(data)
  1. Calculate the Z score:
To calculate the Z score for a specific data point, use the following formula:
Z score = (Data point - Mean) / Standard deviation
For example, to calculate the Z score for the data point 45, use the following code:
RCopy code
data_point <- 45 z_score <- (data_point - mean_data) / sd_data
Calculating Z Score in Python:
  1. Import the required libraries:
To calculate the Z score in Python, you will need the NumPy library for calculating the mean and standard deviation. Install the library if you haven't already, and then import it:
pythonCopy code
import numpy as np
  1. Input your dataset:
Create a list or NumPy array containing your dataset. For example, if you have the dataset {20, 25, 30, 35, 40, 45, 50}, you can create a NumPy array as follows:
pythonCopy code
data = np.array([20, 25, 30, 35, 40, 45, 50])
  1. Calculate the mean and standard deviation:
Use the np.mean() and np.std() functions in Python to calculate the mean and standard deviation of your dataset:
pythonCopy code
mean_data = np.mean(data) sd_data = np.std(data)
  1. Calculate the Z score:
To calculate the Z score for a specific data point, use the following formula:
Z score = (Data point - Mean) / Standard deviation
For example, to calculate the Z score for the data point 45, use the following code:
pythonCopy code
data_point = 45 z_score = (data_point - mean_data) / sd_data

Z Score Calculation Examples

Example 1:

Problem:
A teacher gives a math test to her students, and the scores are as follows: {55, 65, 75, 85, 95}. Calculate the Z score for a student who scored 75 on the test.

Solution:
Step 1: Calculate the mean and standard deviation.
Mean = (55 + 65 + 75 + 85 + 95) / 5 = 375 / 5 = 75 Standard deviation = √[((55-75)^2 + (65-75)^2 + (75-75)^2 + (85-75)^2 + (95-75)^2) / 5] ≈ 14.14

Step 2: Calculate the Z score.
Z score = (Data point - Mean) / Standard deviation Z score = (75 - 75) / 14.14 ≈ 0
Answer: The Z score for a student who scored 75 on the test is 0. This means that the student's score is exactly at the mean of the dataset.
Explanation: The Z score of 0 indicates that the student's score is not deviating from the mean. Since the mean is the central value of the dataset, this suggests that the student's score is relatively common within the dataset.

Example 2:

Problem:
A company measures the time (in minutes) that its employees take to complete a specific task: {15, 20, 22, 24, 30}. Calculate the Z score for an employee who took 15 minutes to complete the task.
Solution:
Step 1: Calculate the mean and standard deviation.
Mean = (15 + 20 + 22 + 24 + 30) / 5 = 111 / 5 = 22.2 Standard deviation = √[((15-22.2)^2 + (20-22.2)^2 + (22-22.2)^2 + (24-22.2)^2 + (30-22.2)^2) / 5] ≈ 5.09
Step 2: Calculate the Z score.
Z score = (Data point - Mean) / Standard deviation Z score = (15 - 22.2) / 5.09 ≈ -1.42
Answer: The Z score for an employee who took 15 minutes to complete the task is approximately -1.42.
Explanation: The negative Z score of -1.42 indicates that the employee's completion time is approximately 1.42 standard deviations below the mean completion time. This suggests that the employee's completion time is relatively fast compared to the other employees in the dataset.

Example 3:
Problem:
The weights (in kilograms) of a group of people are as follows: {60, 65, 70, 75, 80}. Calculate the Z score for a person who weighs 80 kg.
Solution:
Step 1: Calculate the mean and standard deviation.
Mean = (60 + 65 + 70 + 75 + 80) / 5 = 350 / 5 = 70 Standard deviation = √[((60-70)^2 + (65-70)^2 + (70-70)^2 + (75-70)^2 + (80-70)^2) / 5] ≈ 7.07
Step 2: Calculate the Z score.
Z score = (Data point - Mean) / Standard deviation Z score = (80 - 70) / 7.07 ≈ 1.41
Answer: The Z score for a person who weighs 80 kg is approximately 1.41.
Explanation: The Z score of 1.41 indicates that the person's weight is approximately 1.41 standard deviations above the mean weight of the dataset. This suggests that the person's weight is relatively high compared to the other individuals in the dataset.

Example 4:
Problem:
A dataset represents the ages of a group of people: {25, 30, 35, 40, 45}. Calculate the Z score for a person who is 25 years old.
Solution:
Step 1: Calculate the mean and standard deviation.
Mean = (25 + 30 + 35 + 40 + 45) / 5 = 175 / 5 = 35 Standard deviation = √[((25-35)^2 + (30-35)^2 + (35-35)^2 + (40-35)^2 + (45-35)^2) / 5] ≈ 7.07
Step 2: Calculate the Z score.
Z score = (Data point - Mean) / Standard deviation Z score = (25 - 35) / 7.07 ≈ -1.41
Answer: The Z score for a person who is 25 years old is approximately -1.41.
Explanation: The negative Z score of -1.41 indicates that the person's age is approximately 1.41 standard deviations below the mean age of the dataset. This suggests that the person's age is relatively low compared to the other individuals in the dataset.
By calculating Z scores for specific data points, you can easily compare and analyze values within a dataset. This statistical measure can be a helpful tool in various fields, including education, business, and research. 
 

  • Z Table
    • Z Scores to Percentiles Chart
    • Z Score Calculator
    • Z Score Probability Calculator
    • Interactive Z Table
    • Z Score Formula
    • How to calculate the z score
    • How To Use Z-Score Table
    • Calculate Z-score
    • Probability in Statistics
    • Parameters in Statistics
    • Percentile Rank
    • Z Score Chart Basics
    • History of Normal Distirbution
    • Statistics Z Score Jokes
    • When to Use Z Test vs T Test
    • Z Score Practice Problems
    • Z Score Problems
    • Normal Distribution Problems
    • Confidence Interval Calculator >
      • Confidence Interval in Excel
      • 90 confidence interval z score
      • 95 Confidence Interval Z Score
      • 99 Confidence Interval Z Score
    • Z Score Confidence Interval
  • Statistics
    • Statistics Symbols
    • Statistics Formulas >
      • Binomial Coefficient
      • Empirical Rule
      • Correlation Coefficient
    • P Value Calculator >
      • P Value Calculator from Z Score
      • P Value Calculator from T Score
      • P Value Calculator from Chi-Square
      • P Value Calculator from F Ratio (ANOVA)
      • P Value Calculator from Pearson R
      • P Value Calculator Tukey's Q Score
    • Cumulative Binomial Probability Calculator
    • Normal CDF Calculator >
      • Normal CDF Formula
      • Non-normal Distribution
      • How to find normal cdf ti 84
      • Examples of Standard Deviation
      • Sample Standard Deviation on Calculator
      • Standard Deviation vs Variance
      • Population vs. Sample
      • Quantitative vs. Qualitative Data
      • Formula of Standard Deviation for Grouped Data
      • Null Hypothesis vs. Alternative Hypothesis
      • Discrete vs. Continuous Data
      • Mean vs. Median vs. Mode
      • Bayesian vs. Frequentist Statistics
      • What is High Standard Deviation
      • What Does a Standard Deviation of 0 Mean
      • Observational Study vs. Experimental Study
      • Parametric vs. Non-parametric tests
      • What is 1 Standard Deviation Above the Mean
      • How to find correlation coefficient on ti 84
      • How to find linear regression on ti-84
      • How to find solving equations on ti-84
      • How to find quadratic regression on ti-84
      • How to find factorial on ti-84
      • How to find integrals on ti-84
      • How to find confidence intervals on ti-84
      • How to find z-score on ti-84
      • How to find derivatives on ti-84
      • How to find summation on ti-84
      • How to find anova on ti-84
      • How to find graphing functions on ti-84
      • How to find factorial on ti-89
      • How to find integrals on ti-89
      • How to find standard deviation on ti-89
      • How to find derivatives on ti-89
      • How to find linear regression on ti-89
      • How to find matrix operations on ti-89
      • How to find summation on ti-89
      • How to find variance on ti-89
      • How to find Correlation on TI-Nspire
      • How to find Variance on TI-Nspire
      • How to find Standard Deviation on TI-Nspire
      • What Does a Standard Deviation of 2 Mean
      • How to find Linear Regression on TI-Nspire
      • How to find Quadratic Regression on TI-Nspire
      • How to find Matrix Operations on TI-Nspire
      • How to find Solving Equations on TI-Nspire
      • How to find Graphing Functions on TI-Nspire
      • How to find Integrals on TI-Nspire
      • How to find Derivatives on TI-Nspire
      • How to find Summation on TI-Nspire
      • How to find Factorial on TI-Nspire
      • How to find Combinations and Permutations on TI-Nspire
      • How to find Z-Score on TI-Nspire
      • How to find Probability Distributions on TI-Nspire
      • How to find ANOVA on TI-Nspire
      • How to find Histograms on TI-Nspire
      • How to find Box-and-Whisker Plots on TI-Nspire
      • How to find Present and Future Value on TI-Nspire
      • How to find Confidence Intervals on TI-Nspire
      • Population Standard Deviation and Sample Standard Deviation
    • Correlation Calculator >
      • Covariance vs. Correlation
    • Dice Roller
    • Probability Distribution Calculator
    • Interquartile Range Calculator
    • Empirical Rule Calculator
    • Mean, Median and Mode Calculator
    • Average Calculator
    • Linear Regression Calculator
    • Sample Size Calculator
    • Other Statistical Tables >
      • T Value Table
      • Chi-Square Table
      • F Distribution Table
    • Standard Deviation Calculator
    • Standard Deviation Problems
    • Normal vs Non-Normal Distribution: Understanding the Differences
    • Covariance vs. Variance: Understanding the Differences
    • Explanatory Variable: Understanding Its Role in Statistical Analysis
    • Independent variable vs dependent
    • What is a Residual in Statistics?
    • Left Skewed vs. Right Skewed Distributions
    • How to Find Variance on ti 84
    • Real Life Examples of Correlation
    • What is Regression Analysis?
    • Statistics Forum
  • Math
    • Combination Calculator
    • How to Calculate a Combination
    • Combination Formula in Statistics
    • Permutation Calculator
    • Distance Between Two Points Calculator
    • Exploring 7 Unsolvable Math Problems >
      • Riemann Hypothesis
    • Math Problems >
      • Math Problems for 1st Graders
      • Math Problems for 2nd Graders
      • Math Problems for 3rd Graders
      • Math Problems for 4th Graders
      • Math Problems for 5th Graders
      • Math Problems for 6th Graders
      • Math Problems for 7th Graders
      • Math Problems for 8th Graders
      • Math Problems for 9th Graders
      • Math Problems for 10th Graders
      • Math Problems for 11th Graders
    • Times Tables >
      • 1 Times Table
      • 2 Times Table
      • 3 Times Table
      • 4 Times Table
      • 5 Times Table
      • 6 Times Table
      • 7 Times Table
      • 8 Times Table
      • 9 Times Table
      • 10 Times Table
    • Multiplication Tables >
      • Multiplication Table by 20
      • Multiplication Table by 19
      • Multiplication Table by 18
      • Multiplication Table by 17
      • Multiplication Table by 16
      • Multiplication Table by 15
      • Multiplication Table by 14
      • Multiplication Table by 13
      • Multiplication Table by 12
      • Multiplication Table by 11
      • Multiplication Table by 10
      • Multiplication Table by 9
      • Multiplication Table by 8
      • Multiplication Table by 7
      • Multiplication Table by 6
      • Multiplication Table by 5
      • Multiplication Table by 4
      • Multiplication Table by 3
    • Roman Numerals Chart
    • Roman Numerals >
      • Roman Numerals Converter
      • I Roman Numerals
      • II Roman Numerals
      • III Roman Numerals
      • IV Roman Numerals
      • V Roman Numerals
      • VI Roman Numerals
      • VII Roman Numerals
      • VIII Roman Numerals
      • IX Roman Numerals
      • X Roman Numerals
      • XI Roman Numerals
      • XII Roman Numerals
      • XIII Roman Numerals
      • XIV Roman Numerals
      • XV Roman Numerals
      • XVI Roman Numerals
      • XVII Roman Numerals
      • XVIII Roman Numerals
      • LXVI Roman Numerals
      • LXVII Roman Numerals
      • LXVIII Roman Numerals
      • LXIX Roman Numerals
      • LXX Roman Numerals
      • LXXI Roman Numerals
      • LXXII Roman Numerals
      • LXXIII Roman Numerals
      • LXXIV Roman Numerals
      • LXXV Roman Numerals
      • LXXVI Roman Numerals
      • LXXVII Roman Numerals
      • LXXVIII Roman Numerals
      • LXXIX Roman Numerals
      • LXXX Roman Numerals
      • LXXXI Roman Numerals
      • LXXXII Roman Numerals
      • LXXXIII Roman Numerals
      • LXXXIV Roman Numerals
      • LXXXV Roman Numerals
      • LXXXVI Roman Numerals
      • LXXXVII Roman Numerals
      • LXXXVIII Roman Numerals
      • LXXXIX Roman Numerals
      • XC Roman Numerals
      • XCI Roman Numerals
      • XCII Roman Numerals
      • XCIII Roman Numerals
      • XCIV Roman Numerals
      • XCV Roman Numerals
      • XCVI Roman Numerals
      • XCVII Roman Numerals
      • XCVIII Roman Numerals
      • XCIX Roman Numerals
      • C Roman Numerals
      • CI Roman Numerals
      • CII Roman Numerals
      • CIII Roman Numerals
      • CIV Roman Numerals
      • CV Roman Numerals
      • CVI Roman Numerals
      • CVII Roman Numerals
      • CVIII Roman Numerals
      • CIX Roman Numerals
      • CX Roman Numerals
      • CXI Roman Numerals
      • CXII Roman Numerals
      • CXIII Roman Numerals
      • CXIV Roman Numerals
      • CXV Roman Numerals
      • CXVI Roman Numerals
      • CXVII Roman Numerals
      • CXVIII Roman Numerals
      • CXIX Roman Numerals
      • CXX Roman Numerals
      • CXXI Roman Numerals
      • CXXII Roman Numerals
      • CXXIII Roman Numerals
      • CXXIV Roman Numerals
      • CXXV Roman Numerals
      • CXXVI Roman Numerals
      • CXXVII Roman Numerals
      • CXXVIII Roman Numerals
      • CXXIX Roman Numerals
      • CXXX Roman Numerals
      • CXXXI Roman Numerals
      • CXXXII Roman Numerals
      • CXXXIII Roman Numerals
      • CXXXIV Roman Numerals
      • CXXXV Roman Numerals
      • CXXXVI Roman Numerals
      • CXXXVII Roman Numerals
      • CXXXVIII Roman Numerals
      • CXXXIX Roman Numerals
      • CXL Roman Numerals
      • CXLI Roman Numerals
      • CXLII Roman Numerals
      • CXLIII Roman Numerals
      • CXLIV Roman Numerals
      • CXLV Roman Numerals
      • CXLVI Roman Numerals
      • CXLVII Roman Numerals
      • CXLVIII Roman Numerals
      • CXLIX Roman Numerals
      • CL Roman Numerals
      • CLI Roman Numerals
      • CLII Roman Numerals
      • CLIII Roman Numerals
      • CLIV Roman Numerals
      • CLV Roman Numerals
      • CLVI Roman Numerals
      • CLVII Roman Numerals
      • CLVIII Roman Numerals
      • CLIX Roman Numerals
      • CLX Roman Numerals
      • CLXI Roman Numerals
      • CLXII Roman Numerals
      • CLXIII Roman Numerals
      • CLXIV Roman Numerals
      • CLXV Roman Numerals
      • CLXVI Roman Numerals
      • CLXVII Roman Numerals
      • CLXVIII Roman Numerals
      • CLXIX Roman Numerals
      • CLXX Roman Numerals
      • CLXXI Roman Numerals
      • CLXXII Roman Numerals
      • CLXXIII Roman Numerals
      • CLXXIV Roman Numerals
      • CLXXV Roman Numerals
      • CLXXVI Roman Numerals
      • CLXXVII Roman Numerals
      • CLXXVIII Roman Numerals
      • CLXXIX Roman Numerals
      • CLXXX Roman Numerals
      • CLXXXI Roman Numerals
      • CLXXXII Roman Numerals
      • CLXXXIII Roman Numerals
      • CLXXXIV Roman Numerals
      • CLXXXV Roman Numerals
      • CLXXXVI Roman Numerals
      • CLXXXVII Roman Numerals
      • CLXXXVIII Roman Numerals
      • CLXXXIX Roman Numerals
      • CXC Roman Numerals
      • CXCI Roman Numerals
      • CXCII Roman Numerals
      • CXCIII Roman Numerals
      • CXCIV Roman Numerals
      • CXCV Roman Numerals
      • CXCVI Roman Numerals
      • CXCVII Roman Numerals
      • CXCVIII Roman Numerals
      • CXCIX in Roman Numerals
      • CC Roman Numerals
      • 3 in Roman Numerals
      • 4 in Roman Numerals
      • 5 in Roman Numerals
      • 6 in Roman Numerals
      • 7 in Roman Numerals
      • 8 in Roman Numerals
      • 9 in Roman Numerals
      • 10 in Roman Numerals
      • 11 in Roman Numerals
      • 12 in Roman Numerals
      • 13 in Roman Numerals
      • 14 in Roman Numerals
      • 15 in Roman Numerals
      • 16 in Roman Numerals
      • 18 in Roman Numerals
      • 19 in Roman Numerals
      • 20 in Roman Numerals
      • 22 in Roman Numerals
      • 30 in Roman Numerals
      • 50 in Roman Numerals
      • 100 in Roman Numerals
      • 500 in Roman Numerals
      • 1000 in Roman Numerals
      • SAMPLE >
        • TEMP XVII Roman Numerals
    • Percentage Increase Calculator
    • Linear Equations >
      • Two-Variable Linear Equations Test with Answers
      • One Variable Linear Equations >
        • Ax=B Linear Equation Calculator
        • Ax=B Linear Equation Practice Test
    • Decimal Places Value Chart
    • Cone Volume Calculator
    • Circumference Calculator
    • Rounding Calculator >
      • Round 15 to the nearest ten
      • Round 75 to the nearest ten
      • Round 35 to the nearest ten
      • Round 5 to the nearest ten
      • Round 3 to the Nearest Ten
    • Factor Calculator >
      • Factor of 36
      • Factor of 30
      • Factor of 32
      • Factor of 35
      • Factor of 39
      • Factor of 33
      • Factor of 34
      • Factor of 3
      • Factor of 3/4
      • Factor of 38
    • Radius of a Circle
    • Fraction Calculator
    • Perfect Square Calculator >
      • Is 1 a perfect square
      • Is 2 a perfect square
      • Is 8 a perfect square
      • Is 9 a perfect square
      • Is 16 a perfect square
      • Is 20 a perfect square
      • Is 36 a perfect square
      • Is 49 a perfect square
      • Is 81 a perfect square
      • Is 125 a perfect square
    • Random Number Generator >
      • Random and Pseudorandom Numbers
      • What is Random Number
    • Horizontal Line
    • X and Y Axis
    • Margin Calculator
    • Simple Interest Calculator
    • Sig Fig Calculator
    • Right Triangle Calculator
    • Money Counter
    • Root Calculator
    • Table of Square Roots
    • Square Root Calculator >
      • Square root of 2
      • Square root of 8
      • Square root of 5
      • Square root of 4
      • Square root of 3
      • Square root of 64
      • Square root of 10
      • Square root of 16
      • Square root of 25
      • Square root of 12
      • Square root of 50
      • Square root of 20
      • Square root of 9
      • Square root of 100
      • Square root of 36
      • Square root of 6
      • Square root of 49
      • Square root of 1
      • Square root of 32
      • Square root of 40
      • Square root of 81
      • Square root of 18
      • Square root of 72
      • Square root of 13
      • Square root of 80
      • Square root of 45
    • Log Calculator
    • Inequality Symbols
    • Exponent calculator
    • Decimal to Fraction Calculator
    • Fraction to Percent Calculator
    • Scale Factor
  • Unit Conversion
    • Celsius to Fahrenheit Converter >
      • -40 C to F
      • 10 C to F
      • 15 C to F
      • 22 C to F
      • 30 C to F
      • 37 C to F
      • 40 C to F
    • Fahrenheit to Celsius Converter >
      • -40 F to C
      • 17 Fahrenheit to Celsius
      • 18 Fahrenheit to Celsius
      • 19 Fahrenheit to Celsius
      • 20 Fahrenheit to Celsius
      • 23 Fahrenheit to Celsius
      • 26 Fahrenheit to Celsius
      • 27 Fahrenheit to Celsius
      • 28 Fahrenheit to Celsius
      • 37 Fahrenheit to Celsius
      • 40 F to C
      • 60 F to C
      • 68 F to C
      • 69 F to C
      • 70 F to C
      • 72 F to C
      • 75 F to C
      • 80 F to C
      • 90 F to C
      • 100 F to C
      • 180 F to C
      • 220 F to C
      • 350 F to C
    • Weight conversion table kg to lbs
    • Kilograms to Pounds Converter >
      • 1 kg to lbs
      • 2 kg to lbs
      • 3 kg to lbs
      • 4 kg to lbs
      • 6 kg to lbs
      • 8 kg to lbs
      • 10 kg to lbs
      • 12 kg to lbs
      • 15 kg to lbs
      • 16 kg to lbs
      • 20 kg to lbs
      • 23 kg to lbs
      • 25 kg to lbs
      • 30 kg to lbs
      • 40 kg to lbs
      • 45 kg to lbs
      • 50 kg to lbs
      • 53 kg to lbs
      • 56 kg to lbs
      • 57 kg to lbs
      • 58 kg to lbs
      • 59 kg to lbs
      • 60 kg to lb
      • 62 kg to lbs
      • 63 kg to lbs
      • 64 kg to lbs
      • 65 kg to lbs
      • 67 kg to lbs
      • 68 kg to lbs
      • 70 kg to lbs
      • 72 kg to lbs
      • 73 kg to lbs
      • 74 kg to lbs
      • 75 kg to lbs
      • 76 kg to lbs
      • 78 kg to lbs
      • 80 kg to lbs
      • 82 kg to lbs
      • 84 kg to lbs
      • 85 kg to lbs
      • 90 kg to lbs
      • 95 kg to lbs
      • 150 kg to lbs
      • 100 kg to lbs
    • Pounds to Kilograms Converter >
      • 1-10 LB to KG >
        • 1.25 lb to kg
        • 2.25 lb to kg
        • 3.75 lb to kg
        • 1.75 lb to kg
        • 1.56 lb to kg
        • 5.25 lb to kg
        • 2.75 lb to kg
        • 1.87 lb to kg
        • 1.65 lb to kg
        • 2.87 lb to kg
        • 0.75 lb to kg
        • 0.75 lb to kg
        • 1.1 lb to kg
        • 1.21 lb to kg
        • 1.32 lb to kg
        • 3.25 lb to kg
        • 1.55 lb to kg
        • 2.65 lb to kg
        • 1.37 lb to kg
        • 0.55 lb to kg
        • 1.85 lb to kg
        • 2.15 lb to kg
        • 1.14 lb to kg
        • 3.31 lb to kg
        • 0.88 lb to kg
        • 1.15 lb to kg
        • 5.29 lb to kg
        • 0.45 lb to kg
        • 4.75 lb to kg
        • 0.85 lb to kg
        • 0.95 lb to kg
        • 5.11 lb to kg
        • 0.44 lb to kg
        • 1.82 lb to kg
        • 2.85 lb to kg
        • 0.68 lb to kg
        • 1.13 lb to kg
        • 0.05 lb to kg
        • 2.47 lb to kg
        • 3.85 lb to kg
        • 4.23 lb to kg
        • 1.38 lb to kg
        • 2.91 lb to kg
        • 4.12 lb to kg
        • 2.95 lb to kg
        • 5.73 lb to kg
        • 2.99 lb to kg
        • 1.78 lb to kg
        • 3.35 lb to kg
        • 1.92 lb to kg
        • 1.58 lb to kg
        • 5.51 lb to kg
        • 1.28 lb to kg
        • 0.02 lb to kg
        • 1.42 lb to kg
        • 0.89 lb to kg
        • 1.16 lb to kg
        • 1.99 lb to kg
        • 1.69 lb to kg
        • 2.17 lb to kg
        • 1 lb to kg
        • 1.6 lb to kg
        • 2 lb to kg
        • 3 lb to kg
        • 4 lb to kg
        • 5 lb to kg
        • 6 lb to kg
        • 7 lb to kg
        • 8 lb to kg
        • 9 lb to kg
        • 10 lb to kg
      • 11 lb to kg
      • 12 lb to kg
      • 12.5 lb to kg
      • 13 lb to kg
      • 14 lb to kg
      • 15 lb to kg
      • 16 lb to kg
      • 17 lb to kg
      • 18 lb to kg
      • 19 lb to kg
      • 20 lb to kg
      • 21 lb to kg
      • 22 lb to kg
      • 23 lb to kg
      • 24 lb to kg
      • 25 lb to kg
      • 26 lb to kg
      • 27 lb to kg
      • 28 lb to kg
      • 29 lb to kg
      • 30 lb to kg
      • 31 lb to kg
      • 32 lb to kg
      • 33 lb to kg
      • 35 lb to kg
      • 40 lb to kg
      • 45 lb to kg
      • 50 lb to kg
      • 55 lb to kg
      • 60 lb to kg
      • 70 lb to kg
      • 90 lb to kg
      • 98 lb to kg
      • 99 lb to kg
      • 100 lb to kg
      • 130 lb to kg
      • 150 lb to kg
    • Fluid Ounces to Milliliters
    • Kilometers to Miles Converter >
      • 1 kilometer to miles
      • 5 km to miles
      • 10 km to miles
      • 15 km to miles
      • 20 km to miles
      • 50 km to miles
      • 100 km to miles
    • Miles to Kilometers Conversion >
      • 1 mile to kilometers
      • 5 miles to km
      • 10 miles to km
      • 15 miles to km
      • 20 miles to km
    • KPH to MPH Converter >
      • 30 kph to mph
      • 45 kph to mph
      • 60 kph to mph
      • 70 kph to mph
      • 75 kph to mph
      • 90 kph to mph
      • 100 kph to mph
      • 110 kph to mph
      • 120 kph to mph
      • 130 kph to mph
      • 140 kph to mph
      • 150 kph to mph
      • 155 kph to mph
      • 160 kph to mph
      • 165 kph to mph
      • 180 kph to mph
      • 200 kph to mph
      • 210 kph to mph
      • 220 kph to mph
      • 240 kph to mph
      • 250 kph to mph
      • 260 kph to mph
      • 270 kph to mph
      • 280 kph to mph
      • 300 kph to mph
      • 320 kph to mph
      • 360 kph to mph
      • 400 kph to mph
      • 600 kph to mph
      • 800 kph to mph
    • Inches to Millimeters Converter >
      • 1 inch to mm
      • 1.5 inches to mm
      • 2 inches to mm
      • 2.5 inches to mm
      • 3 inches to mm
      • 4 inches to mm
      • 5 inches to mm
      • 6 inches to mm
      • 18 inches to mm
      • 34 inches to mm
      • 160 inches to mm
    • Millimeters to Inches Converter >
      • 1 mm to inches
      • 1.5 mm to inches
      • 2 mm to inches
      • 2.5 mm to inches
      • 3 mm to inches
      • 3.5 mm to inches
      • 4 mm to inches
      • 4.5 mm to inches
      • 5 mm to inches
      • 6 mm to inches
      • 8 mm to inches
      • 10 mm to inches
    • Meters to Feet Converter >
      • 1 Meter to Feet
      • 2 Meters to Feet
      • 3 Meters to Feet
      • 5 Meters to Feet
      • 10 Meters to Feet
      • 20 Meters to Feet
      • 30 Meters to Feet
      • 50 Meters to Feet
      • 100 Meters to Feet
    • Centimeters to Inches Converter >
      • 2 cm to inches
      • 3 cm to inches
      • 5 cm to inches
      • 8 cm to inches
      • 10 cm to inches
      • 12 cm to inches
      • 14 cm to inches
      • 15 cm to inches
      • 17 cm to inches
      • 18 cm to inches
      • 20 cm to inches
      • 21 cm to inches
      • 25 cm to inches
      • 28 cm to inches
      • 30 cm to inches
      • 35 cm to inches
      • 40 cm to inches
      • 50 cm to inches
      • 60 cm to inches
      • 36 cm to inches
      • 45 cm to inches
      • 70 cm to inches
      • 80 cm to inches
      • 90 cm to inches
      • 100 cm to inches
      • 120 cm to inches
      • 150 cm to inches
    • Centimeters to Feet Converter >
      • 150 cm to feet
      • 160 cm to feet
      • 162 cm to feet
      • 163 cm to feet
      • 164 cm to feet
      • 165 cm to feet
      • 170 cm to feet
      • 172 cm to feet
      • 173 cm to feet
      • 175 cm to feet
      • 178 cm to feet
      • 180 cm to feet
      • 182 cm to feet
      • 183 cm to feet
      • 185 cm to feet
      • 190 cm to feet
    • Watts to Amps Calculator >
      • 500 Watts to Amps
      • 800 Watts to Amps
      • 1000 Watts to Amps
      • 1200 Watts to Amps
      • 1500 Watts to Amps
      • 2500 Watts to Amps
      • 3000 Watts to Amps
      • 5000 Watts to Amps
    • MCG to MG Converter >
      • 5 mcg to mg
      • 10 mcg to mg
      • 50 mcg to mg
      • 100 mcg to mg
      • 125 mcg to mg
      • 200 mcg to mg
      • 250 mcg to mg
      • 300 mcg to mg
      • 400 mcg to mg
      • 500 mcg to mg
      • 1000 mcg to mg
  • Date & Time
    • Time Duration Calculator
    • Time Conversion Chart
    • Military Times Chart
    • Military Time Now Clock
    • Military Time Converter
    • GMT Time Clock
    • Time Zone
    • Age Calculator
  • Test Prep
    • CFA Exam Overview >
      • How to Prepare for CFA level 1: An Actionable Study Guide
      • 20 CFA Level 1 Practice Questions
      • CFA Practice Questions for level 1
      • 30 CFA Level 1 Practice Questions
      • CFA Level 2 Practice Exam Questions
      • CFA Sample Practice Questions | Level 3| Answers and Explanations
      • CFA Exam Requirements
      • CFA Level 3 Salary
    • SAT Practice Test Math
    • Math Practice Test HiSET
    • Acing the SAT: A Comprehensive and Actionable Study Guide
    • GMAT Practice Questions Math with Answers and Explanations
    • GMAT Math Formulas Sheet
    • Math Practice Test for GED with Answers and Explanations
    • Math Problems to Solve | Practice Test
    • Free Practice TEAS Test
    • ​GRE Practice Math Questions | Free | Answers & Explanations
    • Formulas for GRE Math Section
    • ACT Practice Test with Answers and Explanations
    • CPA Practice Questions
    • ASVAB Practice Test
    • IQ Test
    • How many hours to study for CPA
    • How to Excel in Your CPA Exams: A Comprehensive Preparation Guide
  • Blog
  • Contact Us
    • Advertise Here
    • Privacy Policy
    • Useful Calculators and Converters
  • Español
    • XVIII Roman Numerals
    • XIX Roman Numerals
    • XX Roman Numerals
    • XXI Roman Numerals
    • XVIII Roman Numerals
    • XXII Roman Numerals
    • XXIII Roman Numerals
    • XXIV Roman Numerals
    • XXV Roman Numerals
    • XXVI Roman Numerals
    • XXVII Roman Numerals
    • XXVIII Roman Numerals
    • XXIX Roman Numerals
    • XXX Roman Numerals
    • XXXI Roman Numerals
    • XXXII Roman Numerals
    • XXXIII Roman Numerals
    • XXXIV Roman Numerals
    • XXXV Roman Numerals
    • XXXVI Roman Numerals
    • XXXVII Roman Numerals
    • XXXVIII Roman Numerals
    • XXXIX Roman Numerals
    • XL Roman Numerals
    • XLI Roman Numerals
    • XLII Roman Numerals
    • XLIII Roman Numerals
    • XLIV Roman Numerals
    • XLV Roman Numerals
    • XLVI Roman Numerals
    • XLVII Roman Numerals
    • XLVIII Roman Numerals
    • XLIX Roman Numerals
    • L Roman Numerals
    • LI Roman Numerals
    • LII Roman Numerals
    • LIII Roman Numerals
    • LIV Roman Numerals
    • LV Roman Numerals
    • LVI Roman Numerals
    • LVII Roman Numerals
    • LVIII Roman Numerals
    • LIX Roman Numerals
    • LX Roman Numerals
    • LXI Roman Numerals
    • LXII Roman Numerals
    • LXIII Roman Numerals
    • LXIV Roman Numerals
    • LXV Roman Numerals
    • XVIII Roman Numerals
    • TEMP XVII Roman Numerals
    • XVIII Roman Numerals >
      • TEMP XVII Roman Numerals
  • Mole Calculator
  • BMI Calculator
  • Tic Tac Toe
  • 100s Chart -Printable
  • Online Timer
  • Online Stopwatch
  • How Many Days Until Chritmas
  • ​Simple Interest Formula Explained
  • Understanding Simple Interest vs. Compound Interest
  • 10 Real-World Simple Interest Examples
  • 20 Simple Interest Problems
  • Compound Interest Practice Problems
  • 34 lb to kg
  • 36 lb to kg
  • 37 lb to kg
  • 38 lb to kg
  • 39 lb to kg
  • 41 lb to kg
  • 42 lb to kg
  • 43 lb to kg
  • 44 lb to kg
  • 46 lb to kg
  • 47 lb to kg
  • 48 lb to kg
  • 49 lb to kg
  • 51 lb to kg
  • 52 lb to kg
  • 53 lb to kg
  • 54 lb to kg
  • 56 lb to kg
  • 57 lb to kg
  • 58 lb to kg
  • 59 lb to kg
  • 61 lb to kg
  • 62 lb to kg
  • 63 lb to kg
  • 64 lb to kg
  • 65 lb to kg