Left Skewed vs. Right Skewed Distributions
Skewness and Distribution Shape
Skewness is a measure that describes the symmetry of a distribution. A distribution is left skewed if it has a longer tail on the left side, and it is right skewed if it has a longer tail on the right side. A distribution with no skew is perfectly symmetrical.
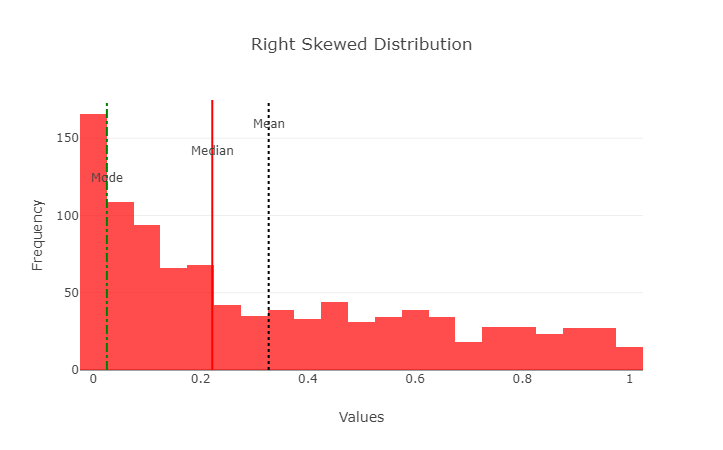
Right Skewed Distribution
A right skewed distribution, also known as a positively-skewed distribution, has a tail that extends towards the higher values. The majority of the data is concentrated towards the lower values.
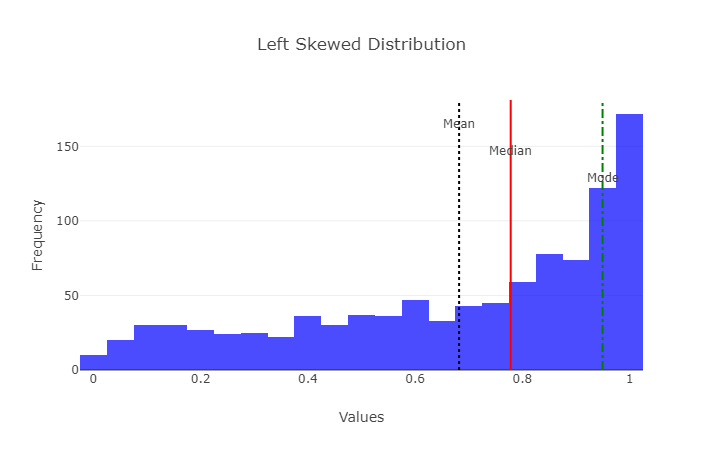
Left Skewed Distribution
A left skewed distribution, also known as a negatively-skewed distribution, has a tail that extends towards the lower values. The majority of the data is concentrated towards the higher values.
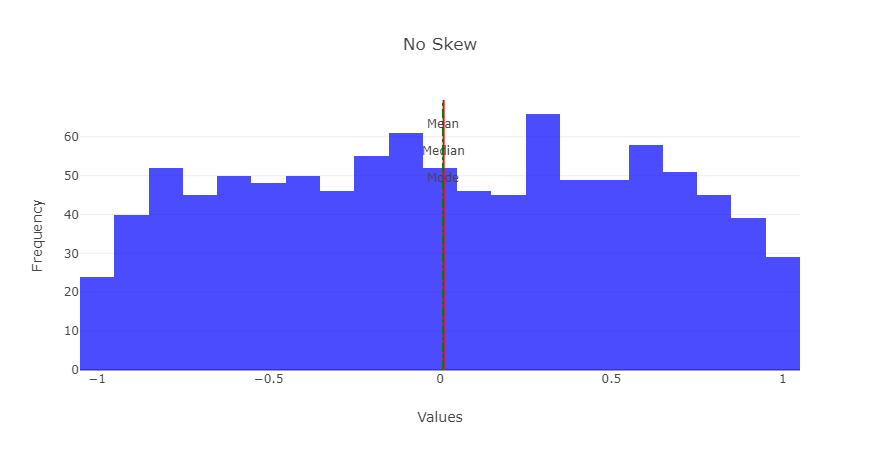
No Skew Distribution
A no skew distribution, also known as a symmetrical distribution, has tails that extend towards both the lower and higher values evenly. The majority of the data is concentrated around the mean.
Properties of Skewed Distributions
Left Skewed Distribution: Mean < Median < Mode
Right Skewed Distribution: Mode < Median < Mean
No Skew: Mean = Median = Mode
Understanding these properties helps in interpreting and analyzing data distributions, providing insights into their shape and central tendency.
Real-Life Examples of Left and Right Skewed Distributions
Left Skewed Distribution
A left skewed distribution, also known as a negatively-skewed distribution, is characterized by a tail that extends towards the lower values. The majority of the data is concentrated towards the higher values. Let's explore some real-life examples of left skewed distributions:
- Income Distribution: In many countries, the distribution of income tends to be left skewed. This means that a large number of individuals earn lower incomes, while only a few individuals earn significantly higher incomes. The tail of the distribution represents the high-income earners, while the bulk of the population falls within the lower-income range.
- Test Scores: In educational assessments, test scores often exhibit a left skewed distribution. This occurs when a significant number of students score relatively low marks, while fewer students achieve high scores. The tail of the distribution represents the high-scoring students, while the majority of students fall within the lower score range.
- Product Lifetimes: The lifetimes of certain products can exhibit left skewed distributions. For example, electronic devices such as smartphones or laptops may have a longer lifespan for the majority of consumers, but a few devices may fail or become obsolete relatively quickly. The tail of the distribution represents the short-lived or faulty devices, while most devices last longer.
Right Skewed Distribution
A right skewed distribution, also known as a positively-skewed distribution, is characterized by a tail that extends towards the higher values. The majority of the data is concentrated towards the lower values. Let's explore some real-life examples of right skewed distributions:
- House Prices: The distribution of house prices often exhibits a right skewed pattern. In many markets, there are a few high-priced luxury properties that significantly contribute to the right tail of the distribution. The bulk of the properties fall within the lower and moderate price range.
- Exam Grades: In some cases, exam grades may follow a right skewed distribution. This occurs when a majority of students score higher marks, while fewer students achieve lower grades. The tail of the distribution represents the low-scoring students, while the majority of students fall within the higher grade range.
- Wealth Distribution: Wealth distribution in a society can often exhibit a right skewed pattern. A small percentage of individuals or households may possess a significant portion of the wealth, contributing to the right tail of the distribution. The majority of individuals have lower levels of wealth.
Left Skewed vs. Right Skewed Distributions: Frequently Asked Questions
-
What is a left skewed distribution?
A left skewed distribution, also known as a negatively-skewed distribution, has a tail that extends towards the lower values. The majority of the data is concentrated towards the higher values.
-
What is a right skewed distribution?
A right skewed distribution, also known as a positively-skewed distribution, has a tail that extends towards the higher values. The majority of the data is concentrated towards the lower values.
-
What causes skewness in a distribution?
Skewness in a distribution is caused by the presence of extreme values on one side, which pull the distribution tail towards that side.
-
How do mean, median, and mode differ in left skewed distributions?
In a left skewed distribution, the mean is typically less than the median and mode. The mean is influenced by the presence of extreme values on the left side of the distribution.
-
How do mean, median, and mode differ in right skewed distributions?
In a right skewed distribution, the mean is typically greater than the median and mode. The mean is influenced by the presence of extreme values on the right side of the distribution.
-
What does it mean if a distribution has no skew?
If a distribution has no skew, it means it is perfectly symmetrical, and the mean, median, and mode are all equal.
-
Are left skewed distributions more common than right skewed distributions?
The occurrence of left skewed or right skewed distributions depends on the specific dataset or phenomenon being observed. Both types of distributions can be encountered in various real-world scenarios.
-
What are some real-life examples of left skewed distributions?
Real-life examples of left skewed distributions include income distribution, test scores, and product lifetimes, where a majority of data concentrates towards higher values.
-
What are some real-life examples of right skewed distributions?
Real-life examples of right skewed distributions include house prices, exam grades, and wealth distribution, where a majority of data concentrates towards lower values.
-
How can skewed distributions impact data analysis?
Skewed distributions can affect the interpretation of data analysis results, as they can influence the mean, median, and mode differently. It's important to consider the skewness when drawing conclusions and making decisions based on the data.


