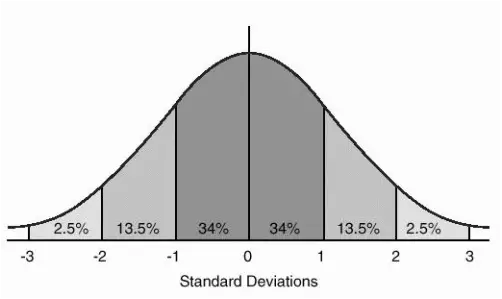
With statistical data sets which follow normal distribution, it is common to standardize all the values to derive standard scores. These scores are referred as z-scores or z-values and can be looked up in the Z score chart. They form a bell shaped standard Z distribution. It is a kind of a normal distribution which always has a mean of zero and a standard deviation of one.
The standard normal distribution and associated z score (from a z score chart) are commonly used for analyzing various data sets and deriving such statistics as percentiles or percentages of the data falling within or beyond certain Z scores. When values in a data set follow normal distribution (i.e. bell shaped), such data set can be standardized by converting each value to a corresponding Z-score. Once standardized meaningful comparisons can be drawn from the data set and more detailed analysis can be performed.
The standard normal distribution and associated z score (from a z score chart) are commonly used for analyzing various data sets and deriving such statistics as percentiles or percentages of the data falling within or beyond certain Z scores. When values in a data set follow normal distribution (i.e. bell shaped), such data set can be standardized by converting each value to a corresponding Z-score. Once standardized meaningful comparisons can be drawn from the data set and more detailed analysis can be performed.
It is helpful to think about z scores in terms of standard deviations, as the values found within Z distribution corresponds to the number of standard deviations below or above the mean. For instance, a z score that equals -2 corresponds to a value which is two standard deviations below the mean. Likewise, if a z score equals 2 then it represents a data point which is two standard deviations above the mean. Minus sign indicates that a value is found on the left of (below) the mean, while a positive score refers to a value which is on the right (above).
Z scores are not something that can only be used by statisticians. They may be very useful to answer very common sense and simple questions. Z distribution is a handy tool to show where a number stands compared to other data points. There is no need to know exact values of the initial unstandardized test to get insight into data. Knowing the z score allows for data interpretation. For instance, if your dietician (which you hopefully do not need) weighs you and then lets you know that your weight is 1 standard deviation higher than the mean. This would tell you that you are heavier than an average person. It seems after all you would need to hit that diet. Just kidding. In order to figure out what percentage of people are lighter or heavier, you would need to consult a z score chart. That’s where you find the percentages learn more specifics.
Z scores are not something that can only be used by statisticians. They may be very useful to answer very common sense and simple questions. Z distribution is a handy tool to show where a number stands compared to other data points. There is no need to know exact values of the initial unstandardized test to get insight into data. Knowing the z score allows for data interpretation. For instance, if your dietician (which you hopefully do not need) weighs you and then lets you know that your weight is 1 standard deviation higher than the mean. This would tell you that you are heavier than an average person. It seems after all you would need to hit that diet. Just kidding. In order to figure out what percentage of people are lighter or heavier, you would need to consult a z score chart. That’s where you find the percentages learn more specifics.
